Nov 19, 2017

USD/JPY’s Sudden Change Of Heart Explained

Not too long ago, on November 6th, the U.S. dollar climbed to as high as 114.73 against the Japanese yen, which was its highest level since mid-March. But instead of maintaining the bullish momentum, USD/JPY had a sudden change of heart and reversed to the south. Two trading weeks later, the pair closed slightly above the 112.00 mark after an intraday low of 111.94 on Friday, November 17th.
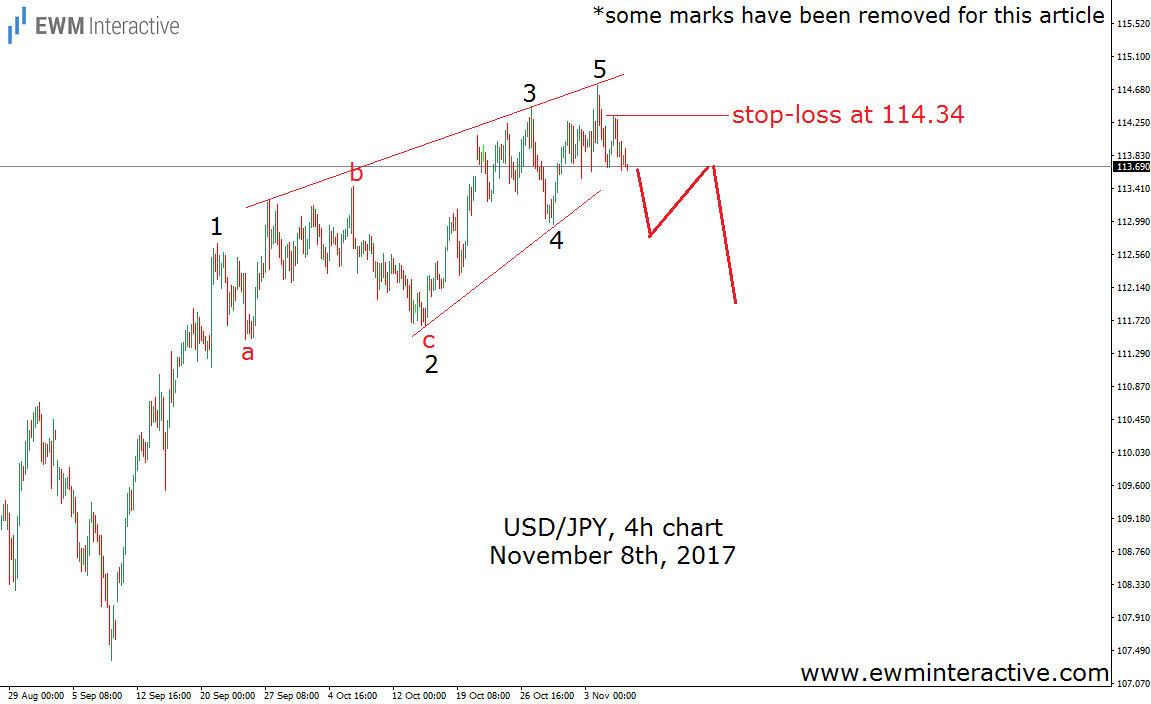
The good news is that the Elliott Wave Principle not only saved us the trouble to search for a reason for this 280-pip selloff, but also put us in the position to take advantage from the better part of it. The chart below was included in the mid-week update we sent to clients on Wednesday, November 8th.(some marks have been removed for this article)
USD/JPY 4hChart
USD/JPY 4hChart
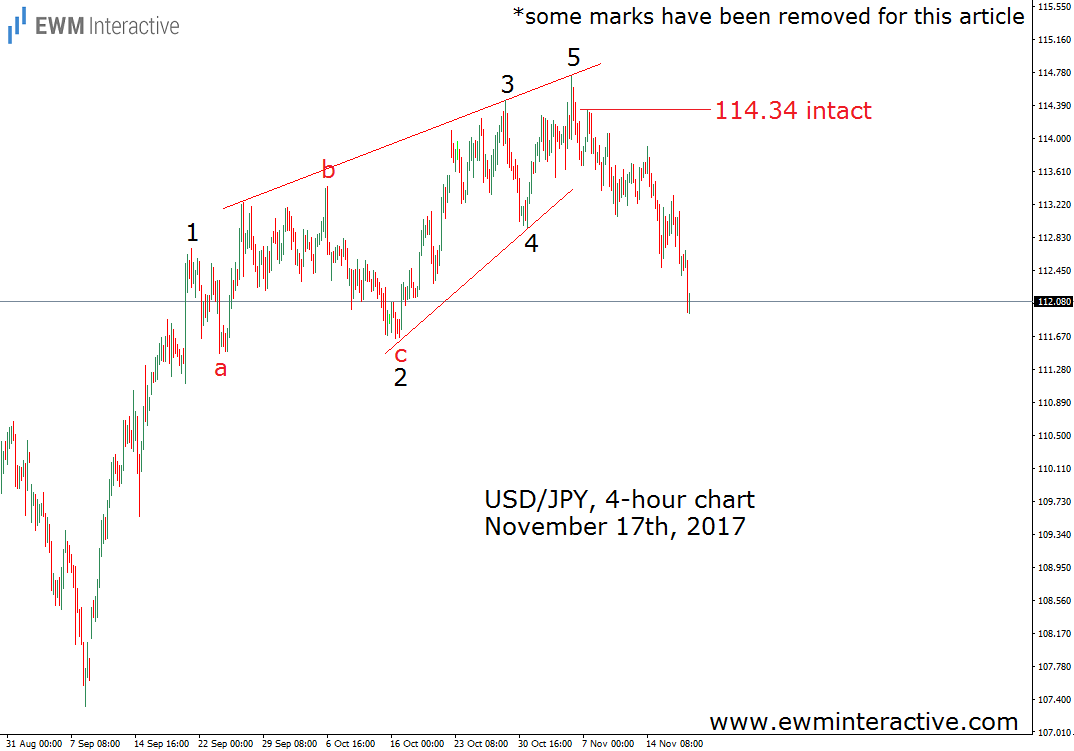
Truth is while USD/JPY was hovering near 114.70, we thought it would go higher, too. But the moment the upper line of the above-shown leading diagonal discouraged the bulls, we knew the rally has been postponed. Which, in turn, revealed a nice short setup, whose targets lied near the support area of wave 2 of the pattern. Furthermore, the Wave principle helped us identify a concrete stop-loss level, in order to reduce the risk. As long as 114.34 was intact, lower levels were anticipated. The chart below shows how USD/JPY has been developing.
USDJPY 4 Hour Chart
USDJPY 4 Hour Chart
First, the all important 114.34 was far from danger the whole time. The rate continued to make lower highs and lower lows until it slightly breached the 112.00 mark yesterday. Once again, Elliott Wave analysis demonstrated its ability to put traders ahead of the news. Besides, the import-export relations between the United States and Japan did not matter, and neither did we have to pay much attention to the US House of Representatives passing the tax reform bill, because a single chart was all a technical analyst needs.
Original post

FX Speculators Raised Their U.S. Dollar Bets For 7th Week

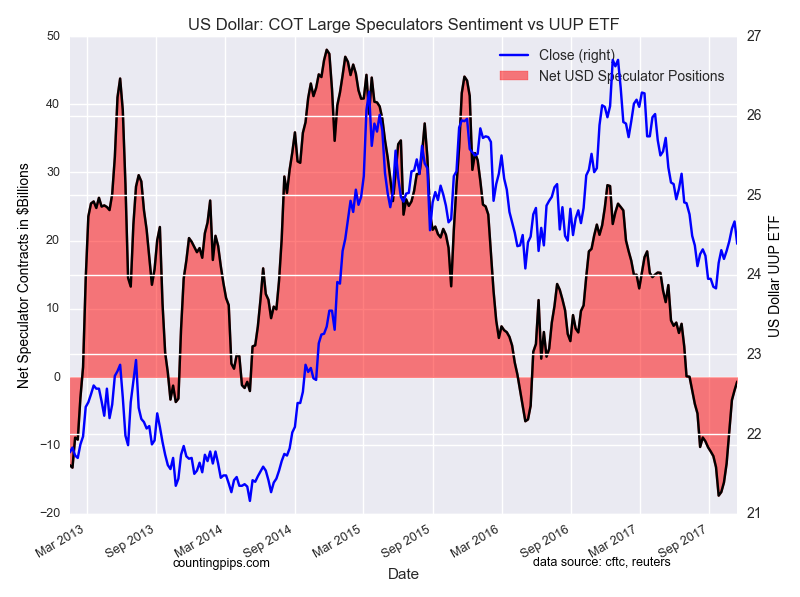
US Dollar COT Large Speculators Sentiment Vs UUP ETF
US dollar net speculator positions stand at $-0.643 billion this week
The latest data for the weekly Commitment of Traders (COT) report, released by the Commodity Futures Trading Commission (CFTC) on Friday, showed that large traders and currency speculators further raised their bets for the US dollar this week.
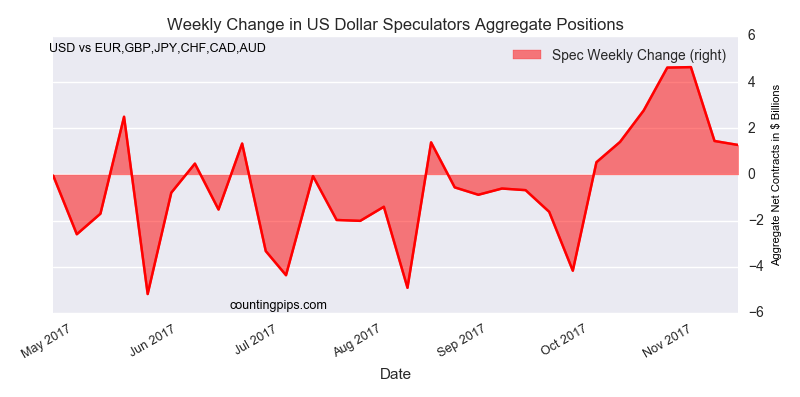
Non-commercial large futures traders, including hedge funds and large speculators, had an overall US dollar net position totaling $-0.643 billion as of Tuesday November 14th, according to the latest data from the CFTC and dollar amount calculations by Reuters. This was a weekly rise of $1.277 billion from the $-1.92 billion total position that was registered the previous week, according to the Reuters calculation (totals of the US dollar contracts against the combined contracts of the euroBritish poundJapanese yenAustralian dollarCanadian dollarand the Swiss franc).
The aggregate speculative US dollar position has improved (become less bearish) for seven consecutive weeks and is now at the lowest bearish level since July.
Weekly Change In US Dollar Speculators Aggregate Positions
Weekly Speculator Contract Changes:
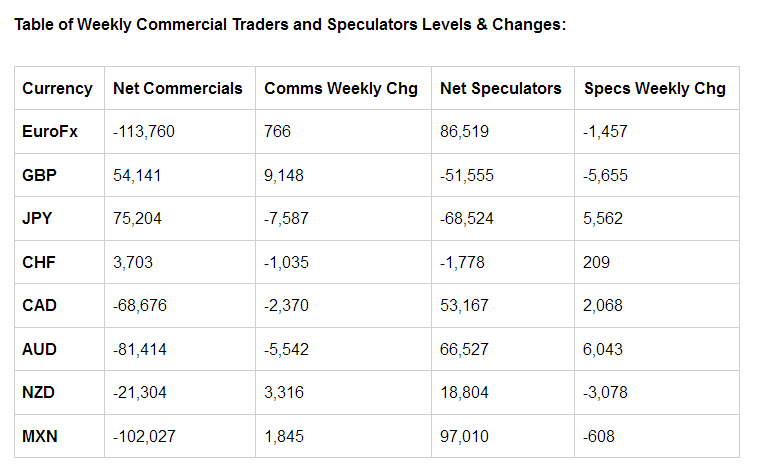
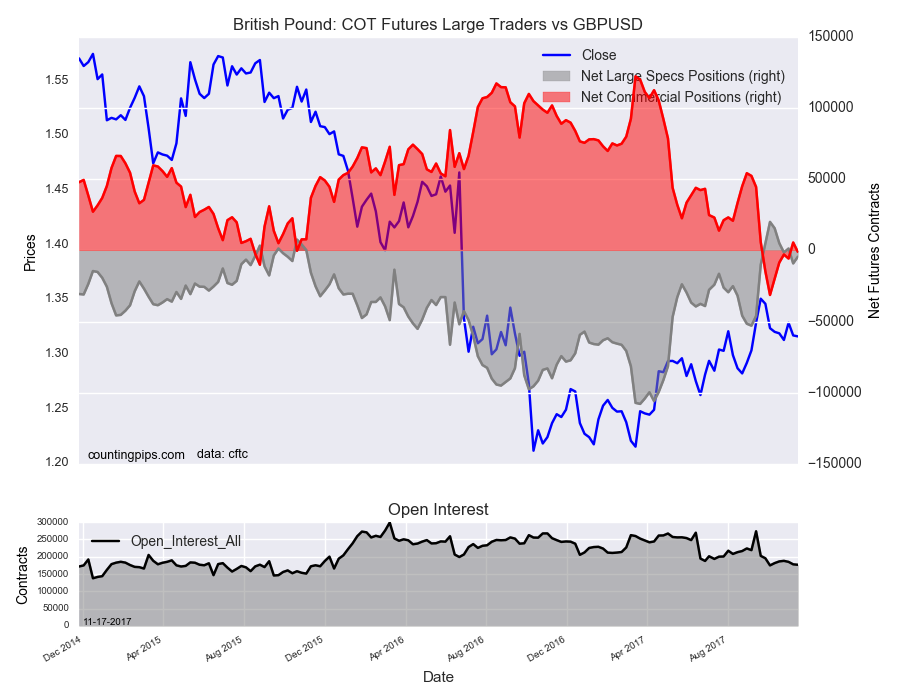
The major currencies that improved against the US dollar this week were the British pound sterling (4,665 weekly change in contracts) and the Mexican peso (5,558 contracts).
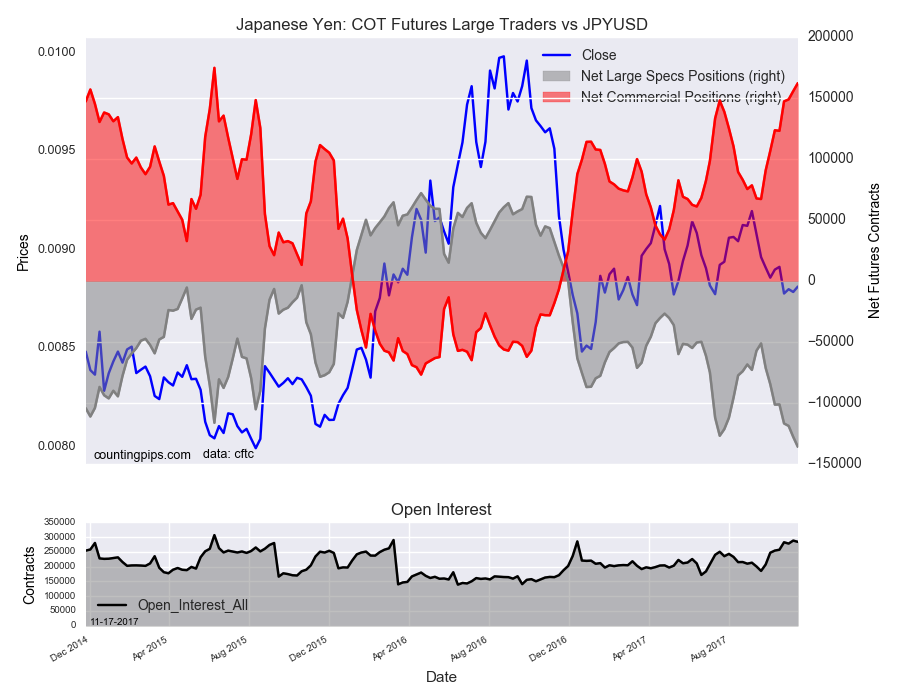
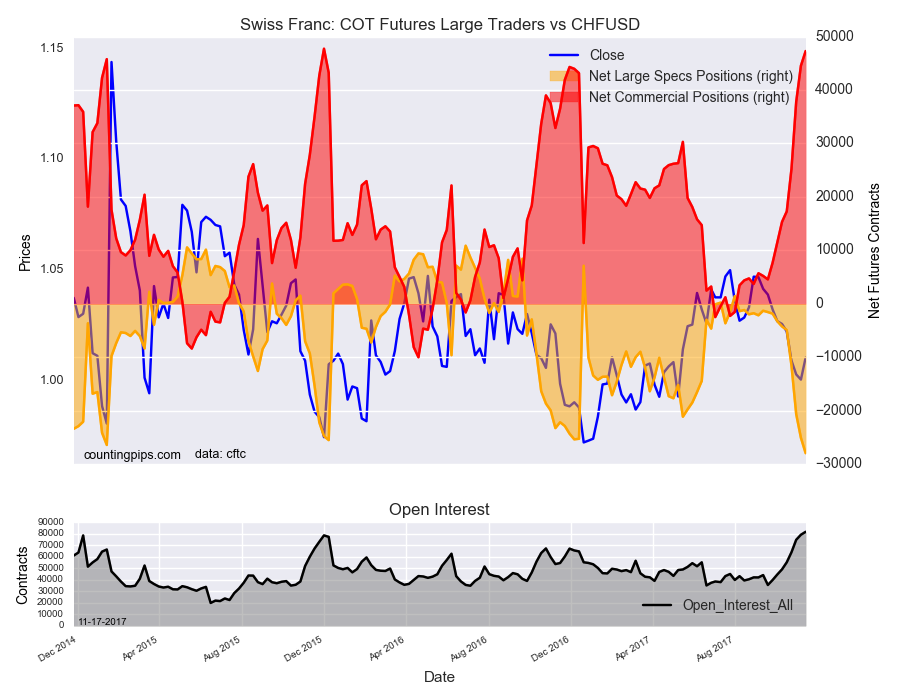
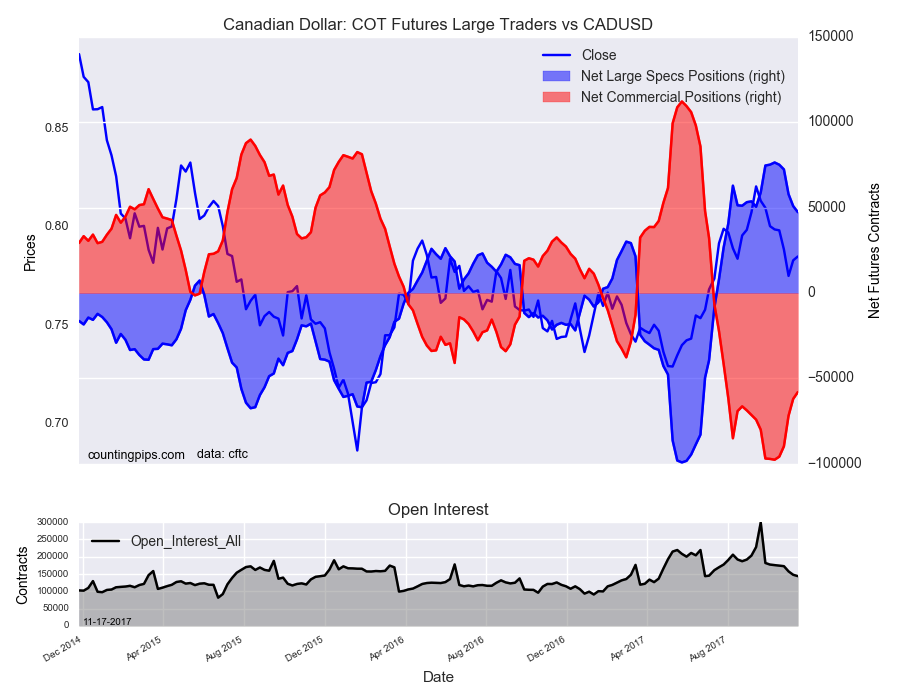
The currencies whose speculative bets declined this week versus the dollar were the euro (-869 weekly change in contracts), Japanese yen (-8,151 contracts), Swiss franc (-2,873 contracts), Canadian dollar (-3,554 contracts), Australian dollar (-1,405 contracts) and the New Zealand dollar (-704 contracts).
Table of Weekly Commercial Traders and Speculators Levels & Changes:
Table of Weekly Commercial Traders and Speculators Levels & Changes

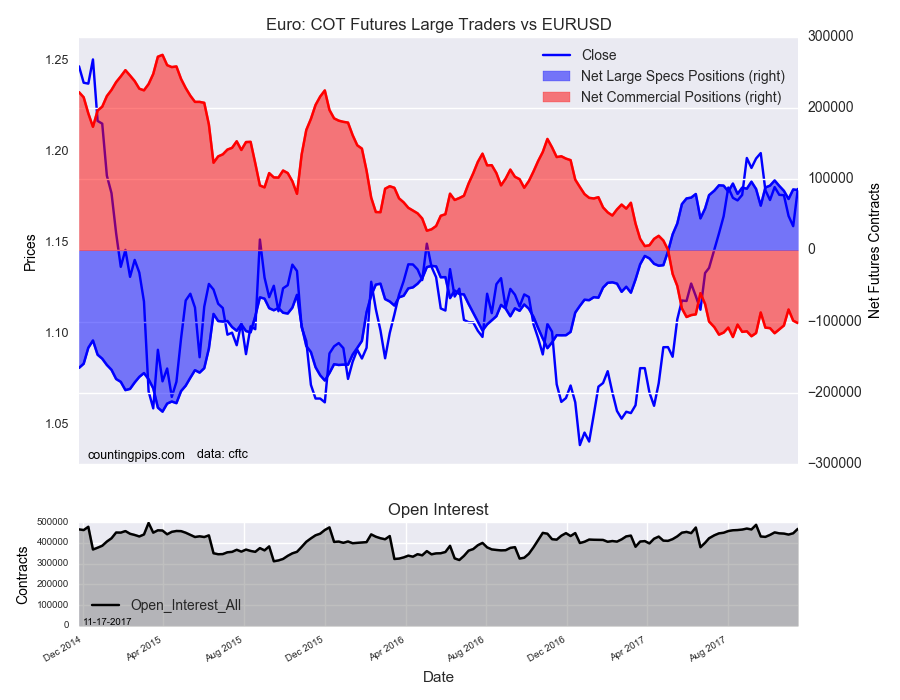
Weekly Charts: Large Trader Weekly Positions vs Price

EuroFX:
Euro : COT Futures Large Traders Vs EUR/USD
British Pound Sterling:
British Pound : COT Futures Large Traders Vs GBP/USD
Japanese Yen:
Japanese Yen : COT Futures Large Traders Vs JPY/USD
Swiss Franc:
Swiss : COT Futures Large Traders Vs CHF/USD
Canadian Dollar:
Canadian Dollar : COT Futures Large Traders Vs CAD/USD
Australian Dollar:
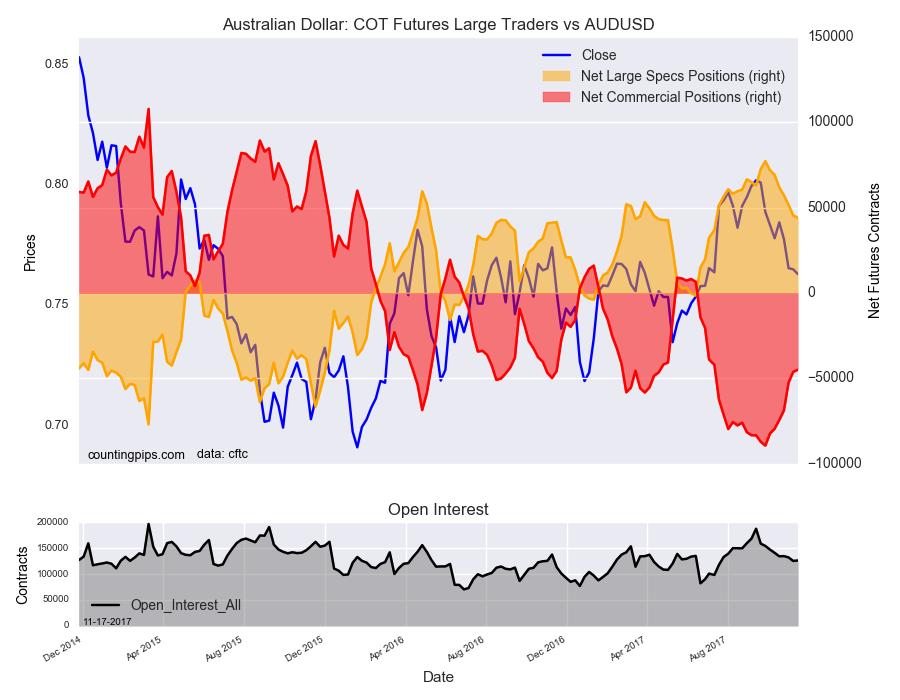
Australian Dollar : COT Futures Large Traders Vs AUD/USD
New Zealand Dollar:
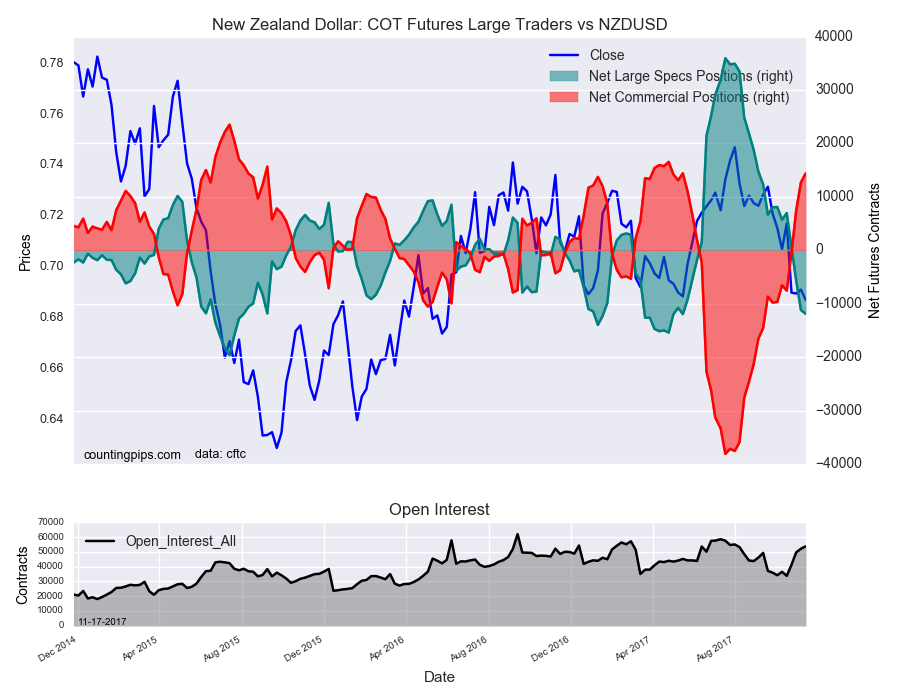
New Zealand Dollar : COT Futures Large Traders Vs NZD/USD
Mexican Peso:
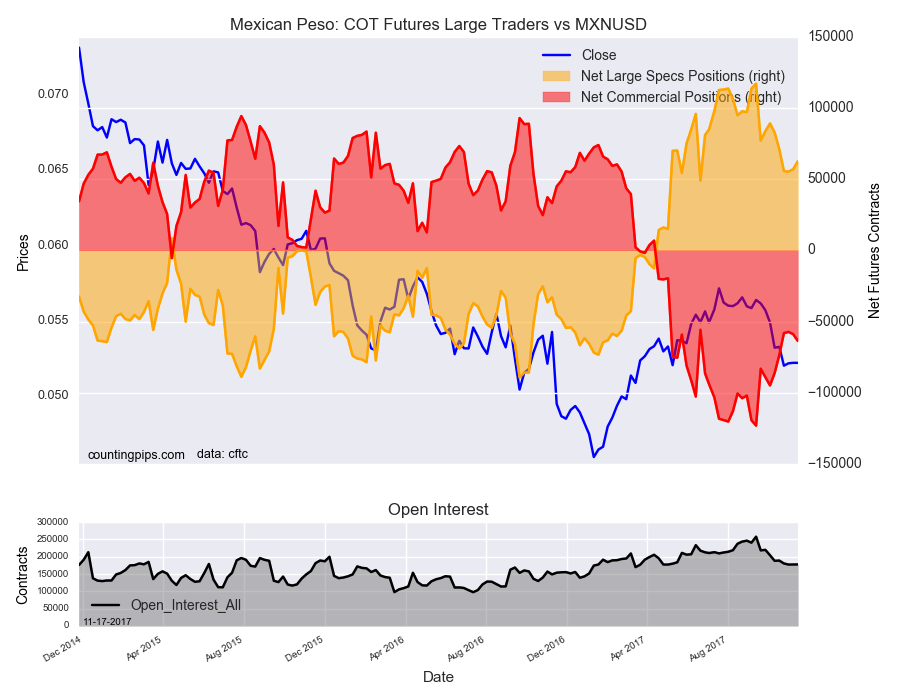
Mexican Peso : COT Futures Large Traders Vs MXN/USD
*COT Report: The weekly commitment of traders report summarizes the total trader positions for open contracts in the futures trading markets. The CFTC categorizes trader positions according to commercial hedgers (traders who use futures contracts for hedging as part of the business), non-commercials (large traders who speculate to realize trading profits) and nonreportable traders (usually small traders/speculators). Find CFTC criteria here: (http://www.cftc.gov/MarketReports/CommitmentsofTraders/ExplanatoryNotes/index.htm).
The Commitment of Traders report is published every Friday by the Commodity Futures Trading Commission (CFTC) and shows futures positions data that was reported as of the previous Tuesday (3 days behind).
Each currency contract is a quote for that currency directly against the U.S. dollar, a net short amount of contracts means that more speculators are betting that currency to fall against the dollar and a net long position expect that currency to rise versus the dollar.
(The charts overlay the forex closing price of each Tuesday when COT trader positions are reported for each corresponding spot currency pair.) See more information and explanation on the weekly COT report from the CFTC website.

Chart of the Week: Deconstructing And Applying Brazilian Real

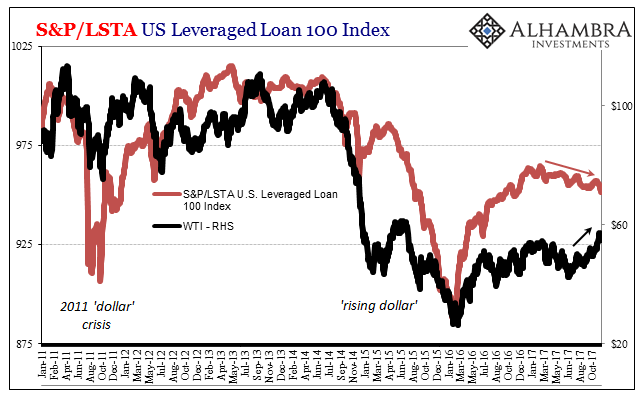
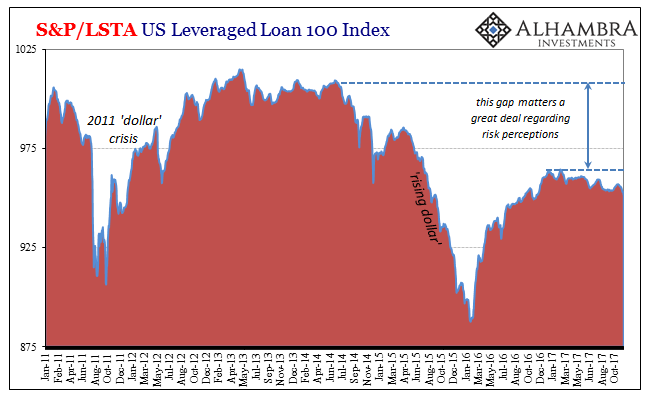
Last week’s Chart of the Week kicks off this week’s, though it will have to wait for a series of explanations to get us from that one to this. A week ago, we noted the growing divergence between leveraged loan prices and WTI, two risk indicators that used to be pretty well correlated for obvious reasons. The S&P/LSTA Leveraged Loan 100 Index did not have a good week this week, while oil was down only somewhat until trading on Friday.
S&P/LSTA US Leveraged Loan 100 Index

S&P/LSTA US Leveraged Loan 100 Index
In broader terms, it’s an indication of latent risk being traded in systemic fashion. This extends, of course, beyond US junk credit and oil into currencies like CNY, HKD, RUB, and BRL; i.e., the eurodollar system. It’s the last one that is of interest today and produces our Chart of the Week (at the bottom).
USD/ Brazilian Real

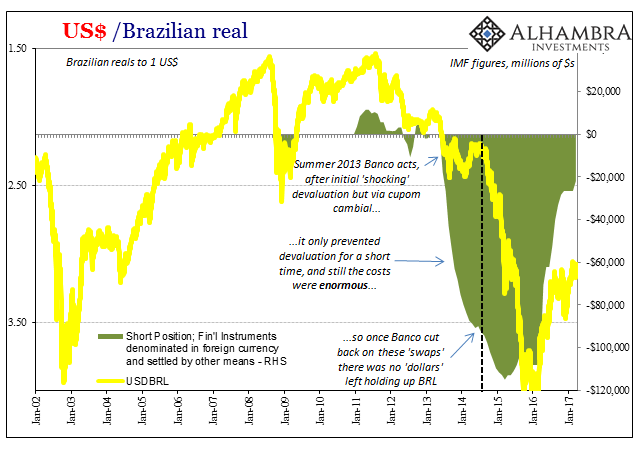
  1. To review recent history for Brazil first as a way of background for it, Banco do Brasil in the radical summer of taper in 2013 began auctioning off swaps as a defensive measure. The real had been under pressure since the end of July 2011 (an especially noteworthy time period), but had appeared to stabilize through 2012 until Bernanke said that magic word the following year.
  2. Dumping to around 2.50 to the dollar, a low almost as bad as Brazil’s worst during the crisis in 2008, the swap regime seemed appropriate. These were not really dollar swaps, though, rather they were more complicated instruments that interfered with the cost of Brazilian banks obtaining “dollars” on global markets (a subsidy). I wrote a short description of this cupom cambial process in October 2013, just a few months after having declared Brazil already toast for doing this very thing.
  3. The way the Brazilian derivatives market works is different than what is implied in mainstream commentary. Without getting too far into those weeds, the Brazilian monetary authorities realized, from past experience with currency depreciation-type emergencies, that they did not necessarily need to offer dollars. Instead, the Brazilian treasury sells, continuously, domestic public debt indexed to US dollar rates.

  4. The Banco’s “swaps”, then, act only on implied future dollar rates, increasing the cupom cambial (the onshore dollar rate implied by currency futures and spreads with dollar rates). In other words, since the central bank “swap” reduces the futures price of dollars in relative comparison to the spot price, there is a greater incentive for banks (both Brazilian and foreign) to borrow US dollars on foreign markets and import them to take advantage of the cupom cambial spread. The swap isn’t really a swap in the conventional sense since the central bank is only swapping dollar indexed securities – deliverable in reals.
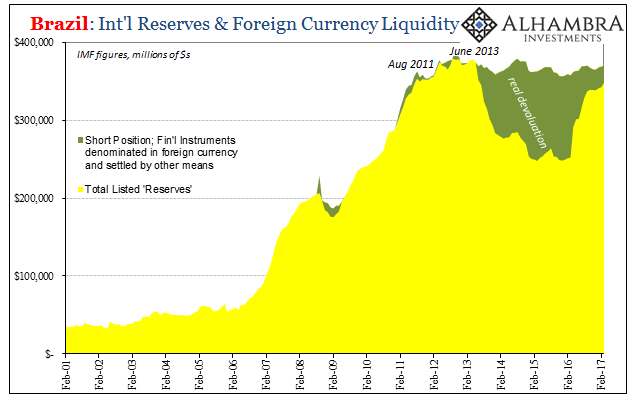
  5. This is why on the IMF call sheets these “swaps” show up in the memorandum items as “Short Position; Financial Instruments Denominated in Foreign Currency and Settled by Other Means.” The reason I believed Brazil was toast was because, as noted in the passage above, Banco was getting local Brazilian banks to go further short the “dollar” just as an enormous short squeeze (the roots of the “rising dollar”) was taking hold. That was apparent to me in 2013 in proportions that were eventually dwarfed by the real action later in 2014.
  6. Brazil


  1. Brazil
  1. By September 2014, Banco had wound up its short position to almost one-quarter of all its listed reserves. From the perspective of the central bank handbook, this is what you do because even at great cost like that the manual says you need only buy some time. In Brazil’s case, the central bank intervention bought about a year.
  2. At that point Banco started scaling back their swap operations and the bottom completely dropped out of the real.
  3. Things started to reverse again in March 2016. Brazil including Petrobras was able to secure dollar financing via Eurobonds as well as swaps with other countries (China), and with a rising real Banco further wound down though not completely their prior (failed) intervention. Yet, BRL is, like oil and US$ junk credit, nowhere near retracing the “rising dollar” devastation.
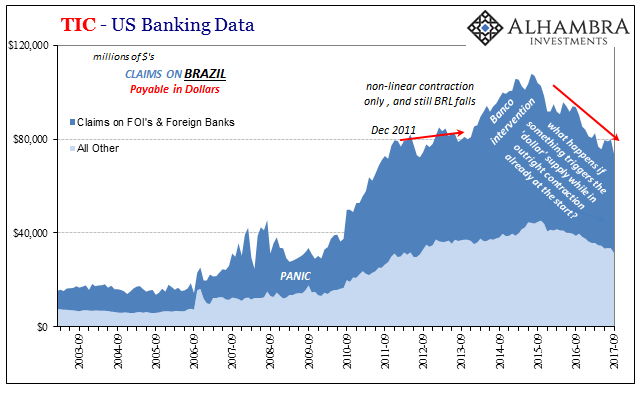
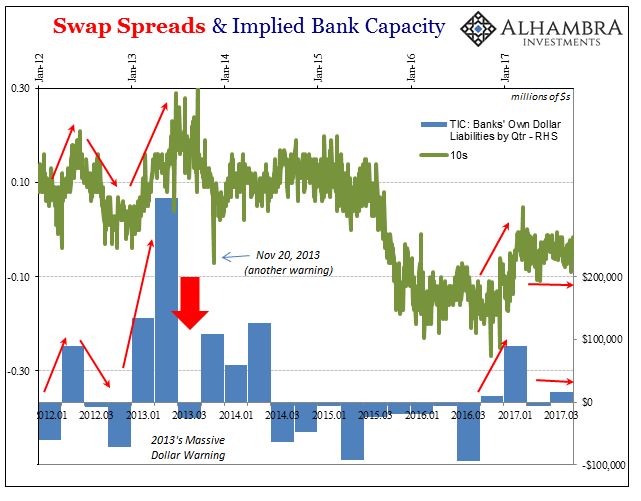
  4. Why? The Chart of the Week, updated TIC, gives us one big part of the answer.
  5. TIC - US Banking Data


  1. TIC - US Banking Data
  1. Look at the TIC US Bank data like Brazil’s “dollar” baseline. At first it doesn’t appear to have been all that bad from 2011 to the middle of 2013, and still BRL was hit pretty hard. Non-linear contraction isn’t just mathematics. Since Banco’s intervention ended, Brazil’s “dollar” baseline has shrunk back to less than what it was in 2011 the last time BRL was pushing 1.50, not stuck at 3.20. And it still actively declining.
  2. The difference is pure liquidity risk. Right now BRL is gently declining but only because right at this moment the global “dollar” condition isn’t actively destructive. It’s not quite benign, but it’s not falling apart like 2014-16, either.
  3. Swap Spreads


  1. Swap Spreads
  1. If, however, the “dollar” supply was to shift more problematic, Brazil has no cushion with which to absorb that hit. Would another “swaps” intervention even have much effect? I would hope not, expecting that Brazilian banks would have learned at least something from the 2013-14 experience.
  2. In other words, Brazil is hugely exposed to the eurodollar, still, even more so (linear contraction in “dollar” funding over the past two years as compared to at least stable funding balances after 2011) than it was when all the shooting started four years ago.
  3. This problematic state obviously applies to more than just Brazil and reals. Thus, price rebounds in a lot of places and markets that aren’t really rebounds. Huge downside monetary risks remain, waiting only for the “next one” to trigger them.

Dec 27, 2012

Another simple system - Time-Frame 15


Hello Folks
After a long wait...i finally introduce you to a new method.This is proven to be 80 percent profitable for me.
About Me : I have been trading forex for over 2 years now.Before the forex market i was trading stocks for a while.but forex was more interesting than the stupid stock market.
Sorry for my english..its not my mother tongue.
THE SYSTEM: TIME-FRAME 15

This strategy is based purely on price action.however just to confirm the same we will look where the price is bouncing off from.for example on any time frame the 200 EMA is very well respected.so this strategy we use only 15min timeframe.why coz less than 15min will give you more fakeys and more than this will take huge stoploss which is not ok with me.since i dont trade in millions..what we are trying to do here is to make maximum money with little investement.
I will explain in detail how to take these bounce trades after the TDI confirmation. I don't believe in adding lot of MA as it will spoil the look of the chart.The time we will look for trades is after the LONDON market opens..why?that is when more money will come to the market.more money means more momentum more momentum means more pips.more pips more money you can take home.

THE SETUP:
We will wait for the LONDON to open.after it opens we will look for trades AWAY from the 200 EMA.thre are more than one setup..but for the beginners of this system.please practice your eyes for this one setup and later I will elaborate on the other setups.Before you take a trade the price should close below the 10EMA for short and above 10EMA for long. MONEY MANAGEMENT SL is 20 Pips TP is upto a trader you may let it run till the tdi crosses back.or you may close at 1:1 upto you. As many other system even this has failure at very high volatile times.please demo it demo it demo it..till you become consistent with this strategy. I move my stop to BE after 12 pips..i don't want to give the pips back the market whats in my pocket.never risk more than 2 % on a single trade
This will be very easy if you already trading using TDI.For this setup the TDI GREEN should cross the Yellow line.Please read dean Malone TDI usage guide for more information on TDI..Later we shall talk about re entries and other setups later coz it will confuse all the newbies..see below for the chart attached

INDICATORS USED:11 1)200 EMA ( 1HR 50EMA) 2)800 EMA ( 4HR 50 EMA) 3) 10EMA 4)Round number indicator 5)Trading Time Indicator
Attached Thumbnails
Click image for larger version

Name: set.gif
Views: 20559
Size: 11.9 KB
ID: 910386

Dec 21, 2012

Forex Trading Systems – Ping Pong Trade

Forex Trading Systems – Ping Pong Trade


I like to call this a ping pong trade. A nice forex price action pin bar formed on the forex pair: Usd Chf Its a price action forex pin bar that is in line with the uptrend. (Remember to always trade with the trend) Moreover, it has the 150 moving average (marked by the orange line) as support. By just judging the above points alone and not adding other confluences, its a already a good trade to enter. So where is our First take profit area? The blue line of course. Our 200 moving average. Price will definitely stop at the area for some resistance. So that will be our take profit target. So its pretty simple. Price touches the 150, and bounces back up to the 200. Just like a ping pong. Forex Trading Systems – Ping Pong trade Follow up


Price indeed reached the 200 moving average to find resistance. And we have gotten our profit. A quick profit we got here. What we can learn from this scenario: Forex trading need not be hard. By looking at it in this way, it is plain and simple. No difficult forex indicators whatsoever. Just price action with moving average = Profits Check out our Winning Asia Forex Mentor Price Action Forex Course where i teach you the exact FULL Forex Trading Systems that i personally use. See you on the other side my friend,